Note
Click here to download the full example code
Plot lines
Plotting lines is handled by pygmt.Figure.plot.
import pygmt
Plot lines
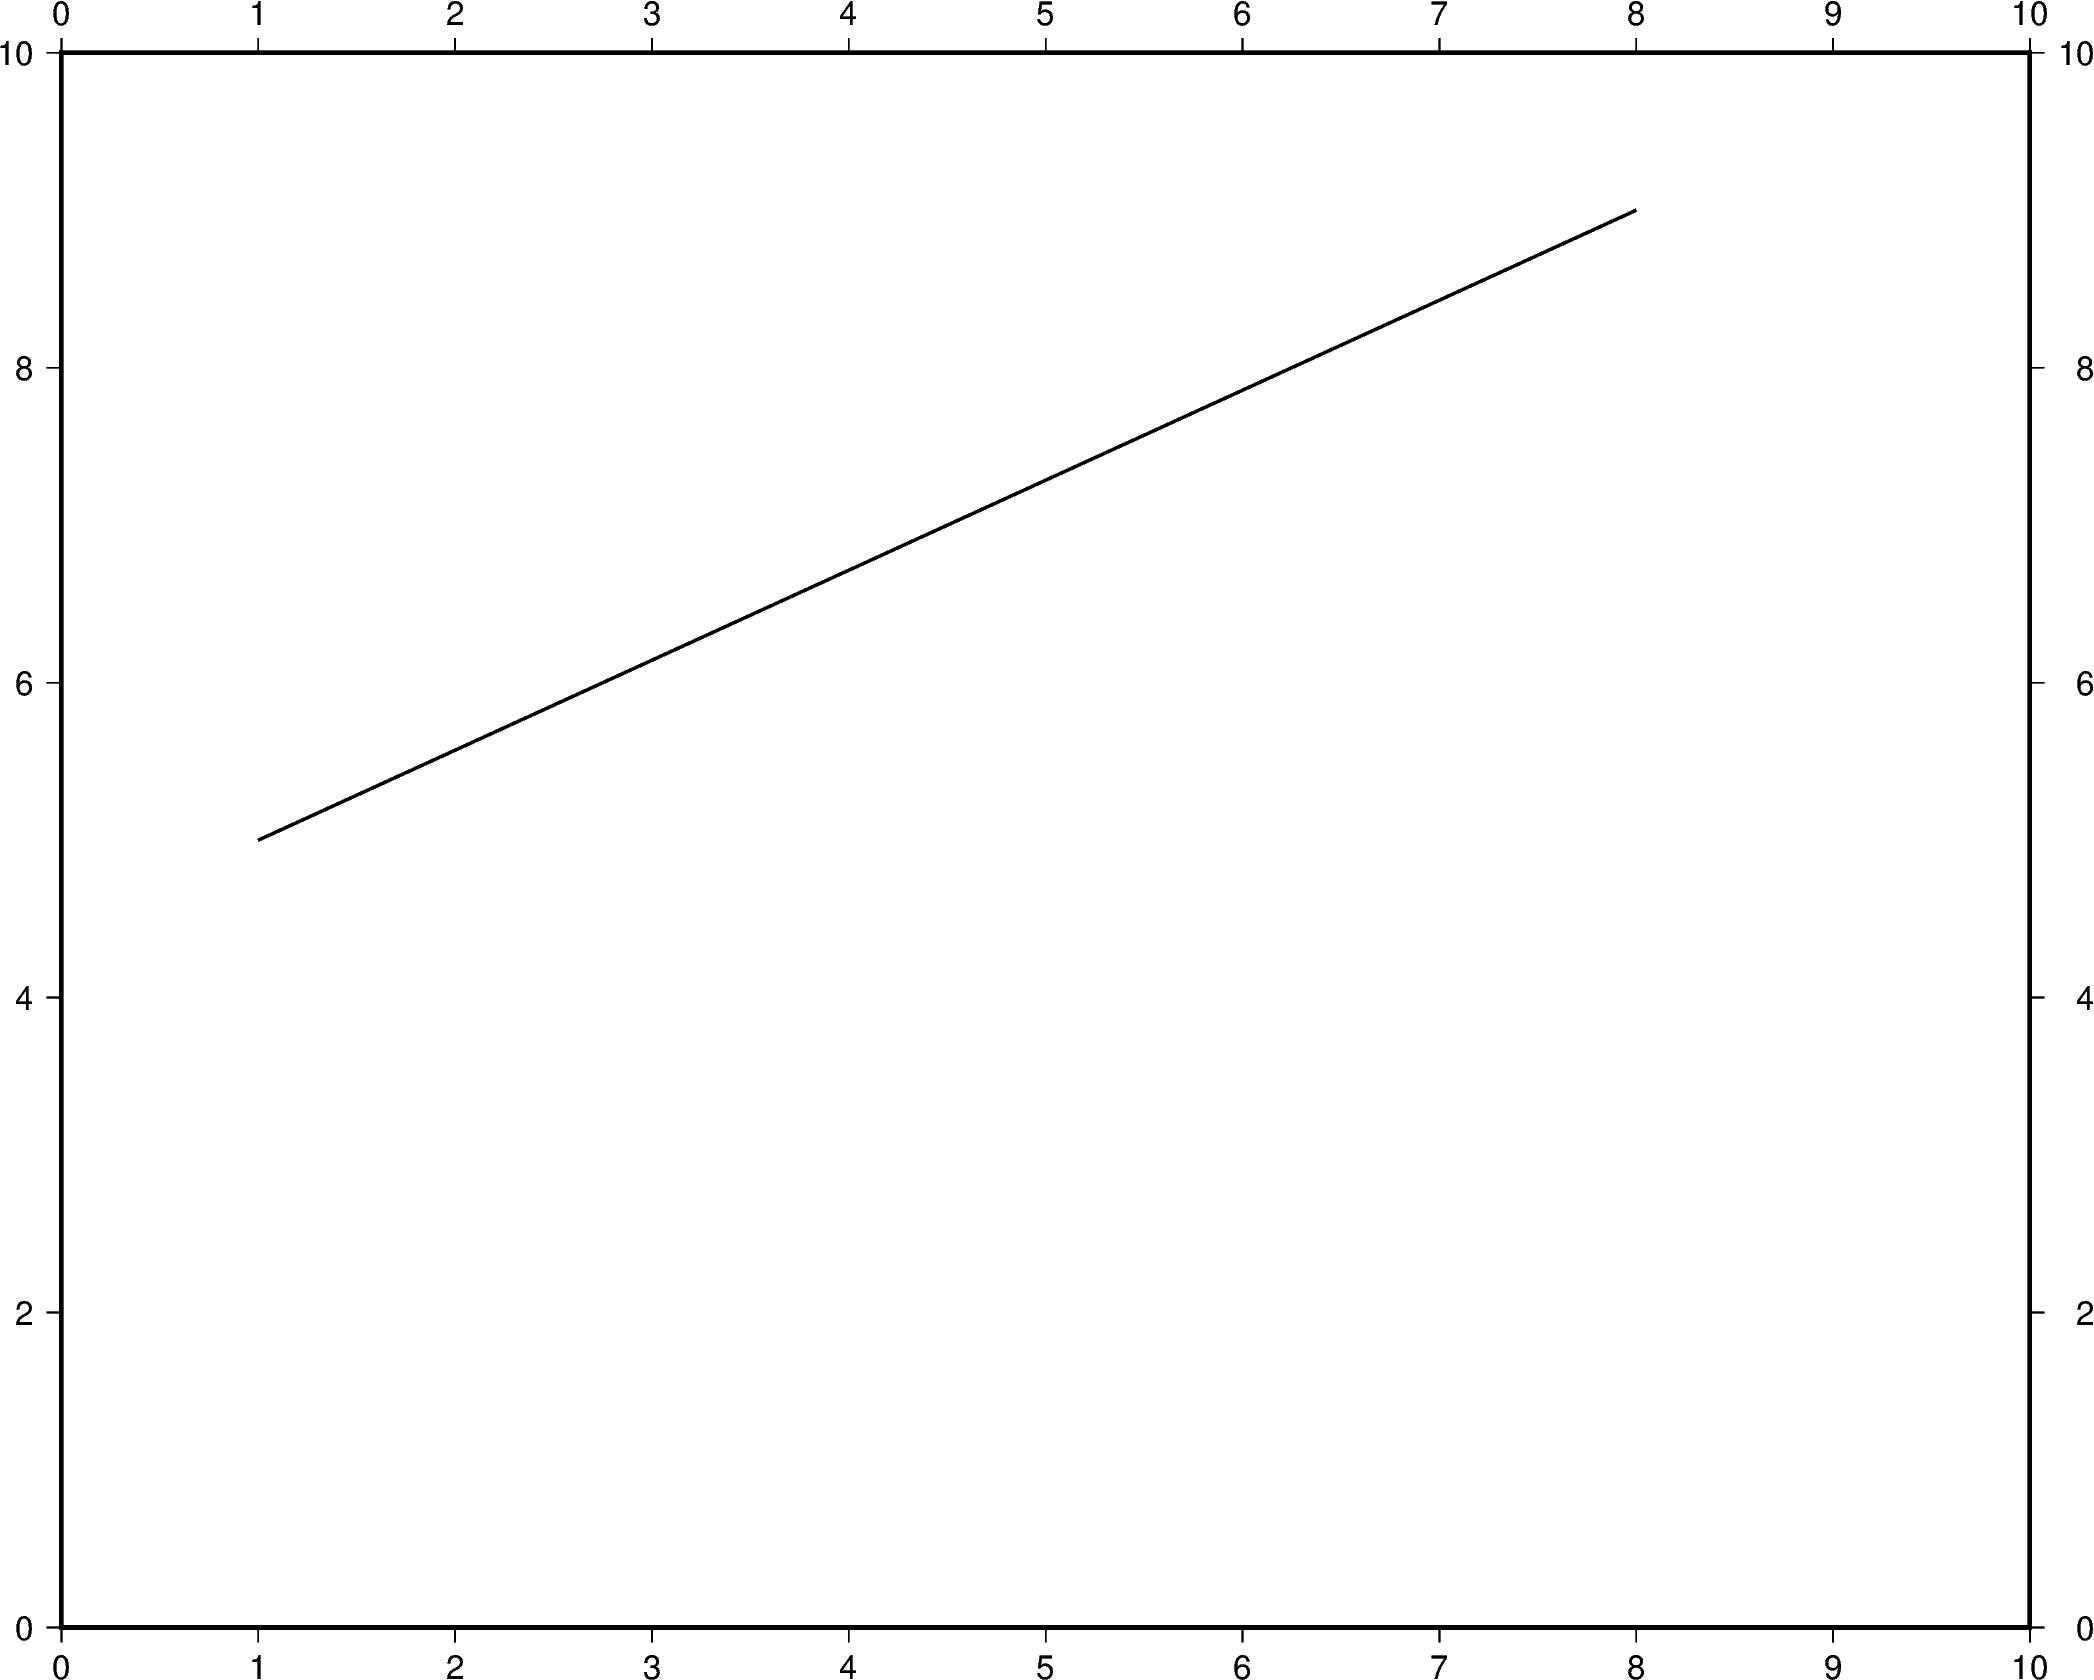
Create a Cartesian figure using projection parameter and set the axis scales
using region (in this case, each axis is 0-10). Pass a list of``x`` and y
values to be plotted as a line.
fig = pygmt.Figure()
fig.plot(
    region=[0, 10, 0, 10],
    projection="X25c/20c",
    frame="a",
    x=[1, 8],
    y=[5, 9],
    pen="1p,black",
)
fig.show()
Out:
<IPython.core.display.Image object>
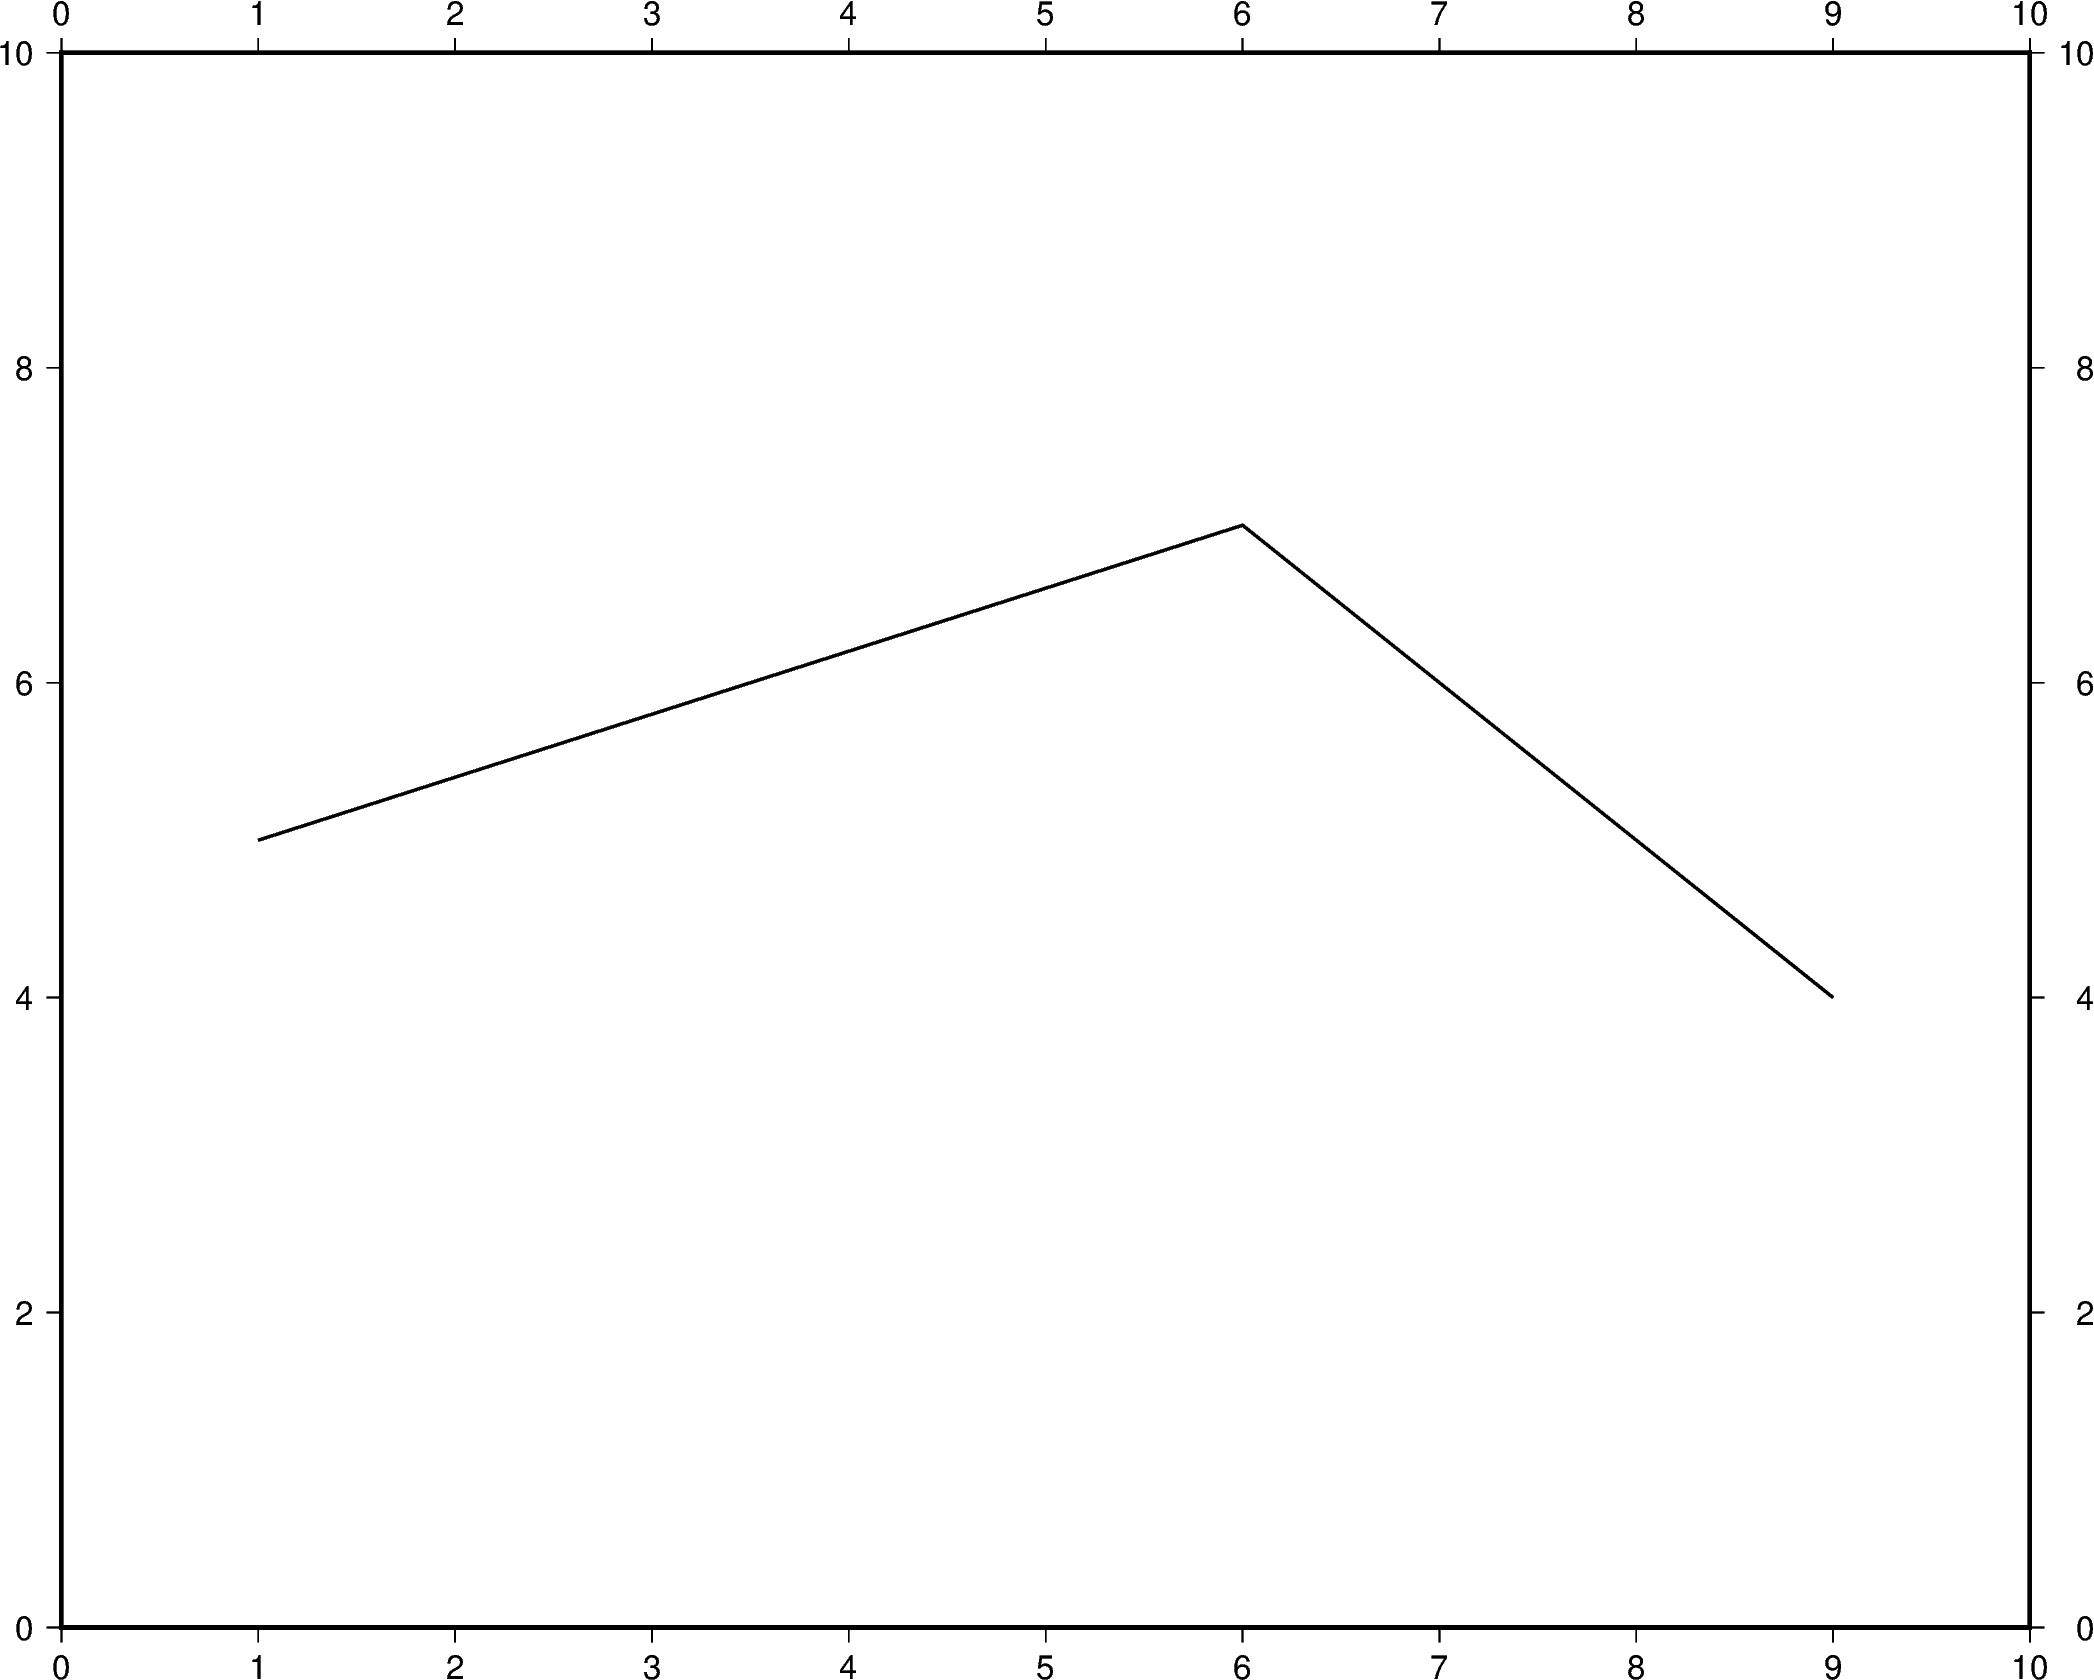
Additional line segments can be added by including additional values for x
and y.
fig = pygmt.Figure()
fig.plot(
    region=[0, 10, 0, 10],
    projection="X25c/20c",
    frame="a",
    x=[1, 6, 9],
    y=[5, 7, 4],
    pen="1p,black",
)
fig.show()
Out:
<IPython.core.display.Image object>
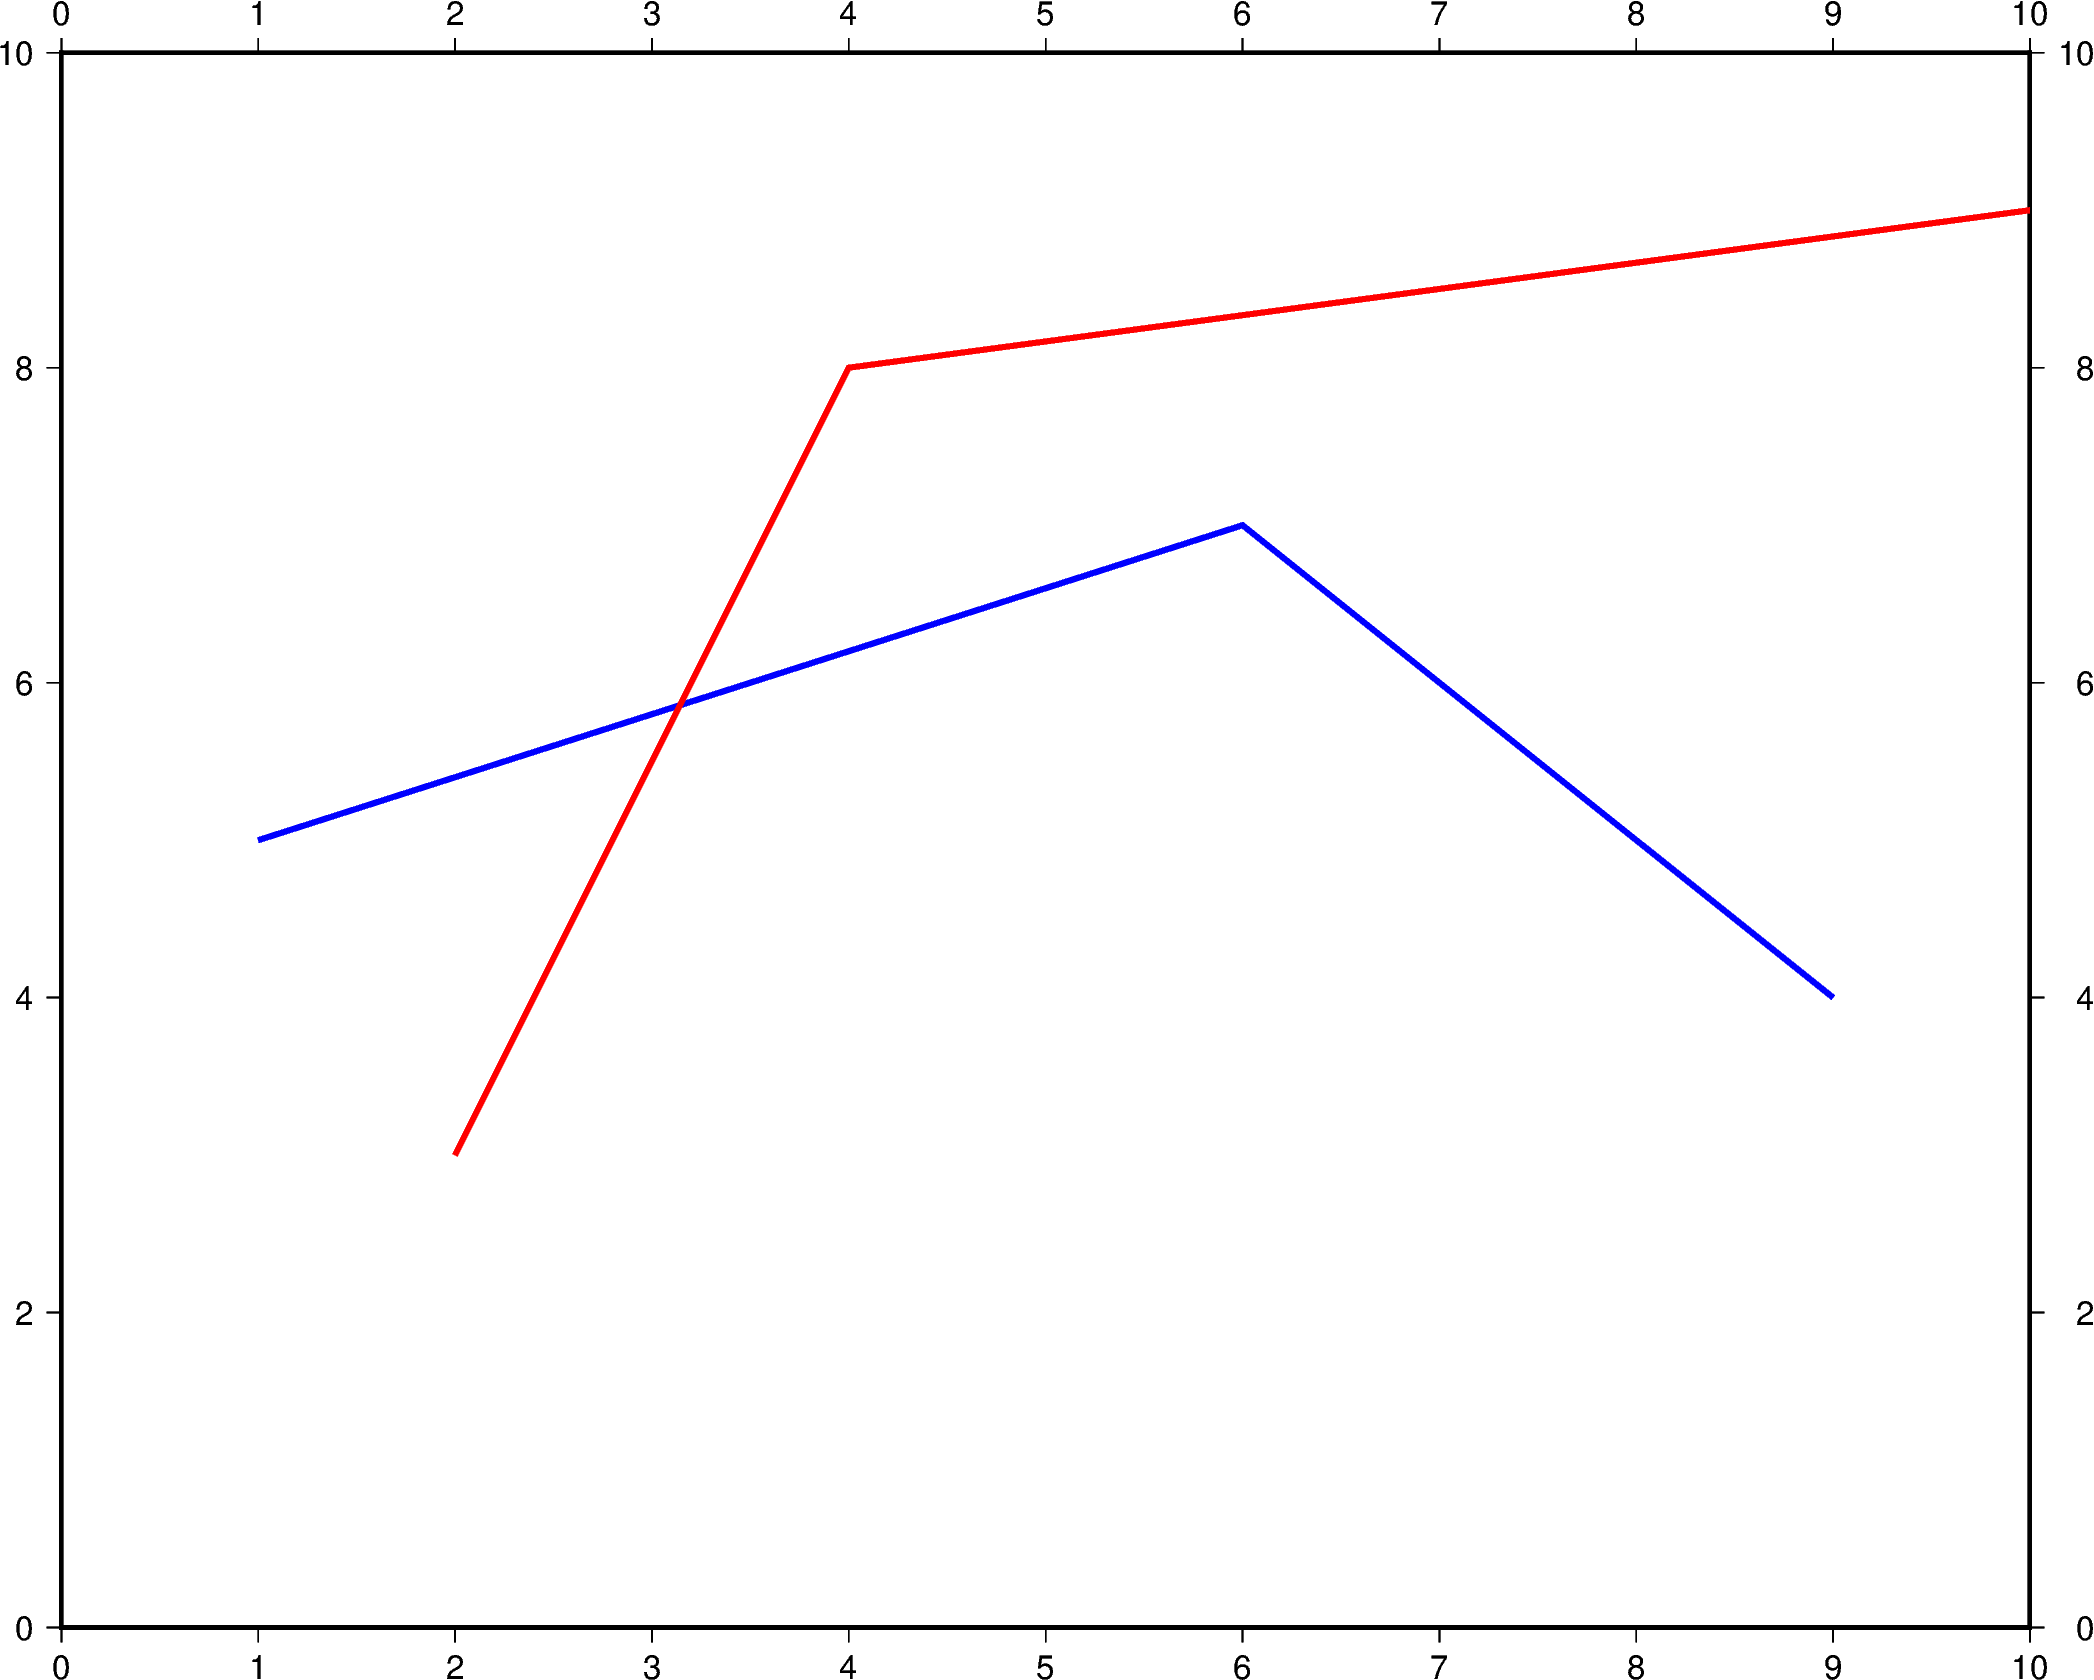
To plot multiple lines, pygmt.Figure.plot needs to be used for each
additional line. Parameters such as region, projection, and frame do
not need to be repeated in subsequent uses.
fig = pygmt.Figure()
fig.plot(
    region=[0, 10, 0, 10],
    projection="X25c/20c",
    frame="a",
    x=[1, 6, 9],
    y=[5, 7, 4],
    pen="2p,blue",
)
fig.plot(x=[2, 4, 10], y=[3, 8, 9], pen="2p,red")
fig.show()
Out:
<IPython.core.display.Image object>
Total running time of the script: ( 0 minutes 2.960 seconds)